Introduction to Metrics
Metrics are powerful tools that bring key data from your organization into your journey maps, enabling data-driven decision making, insight discovery, and opportunity spotting.
What are Metrics in Journey Mapping? 🤔
Metrics in journey mapping are quantitative measurements that provide concrete data points to support and enhance your customer journey analysis. They help you:
- Validate assumptions about customer behavior
- Identify pain points and areas for improvement
- Measure the impact of changes to your customer experience
- Prioritize initiatives based on data-driven insights
Incorporating metrics into your journey maps transforms them from static visualizations into dynamic, actionable tools for continuous improvement.
Quick look at adding a metric 👀
Data Sources for Metrics 📈
Smaply supports various data sources to populate your metrics:
- Manual Entry: Ideal for quick updates or one-off data points
- Excel or CSV paste/import: Perfect for bulk data or periodic updates
- Live Integration: Connect directly to analytics and other data tools for real-time insights
Leveraging live integrations ensures your journey maps always reflect the most current data, enabling agile decision-making.
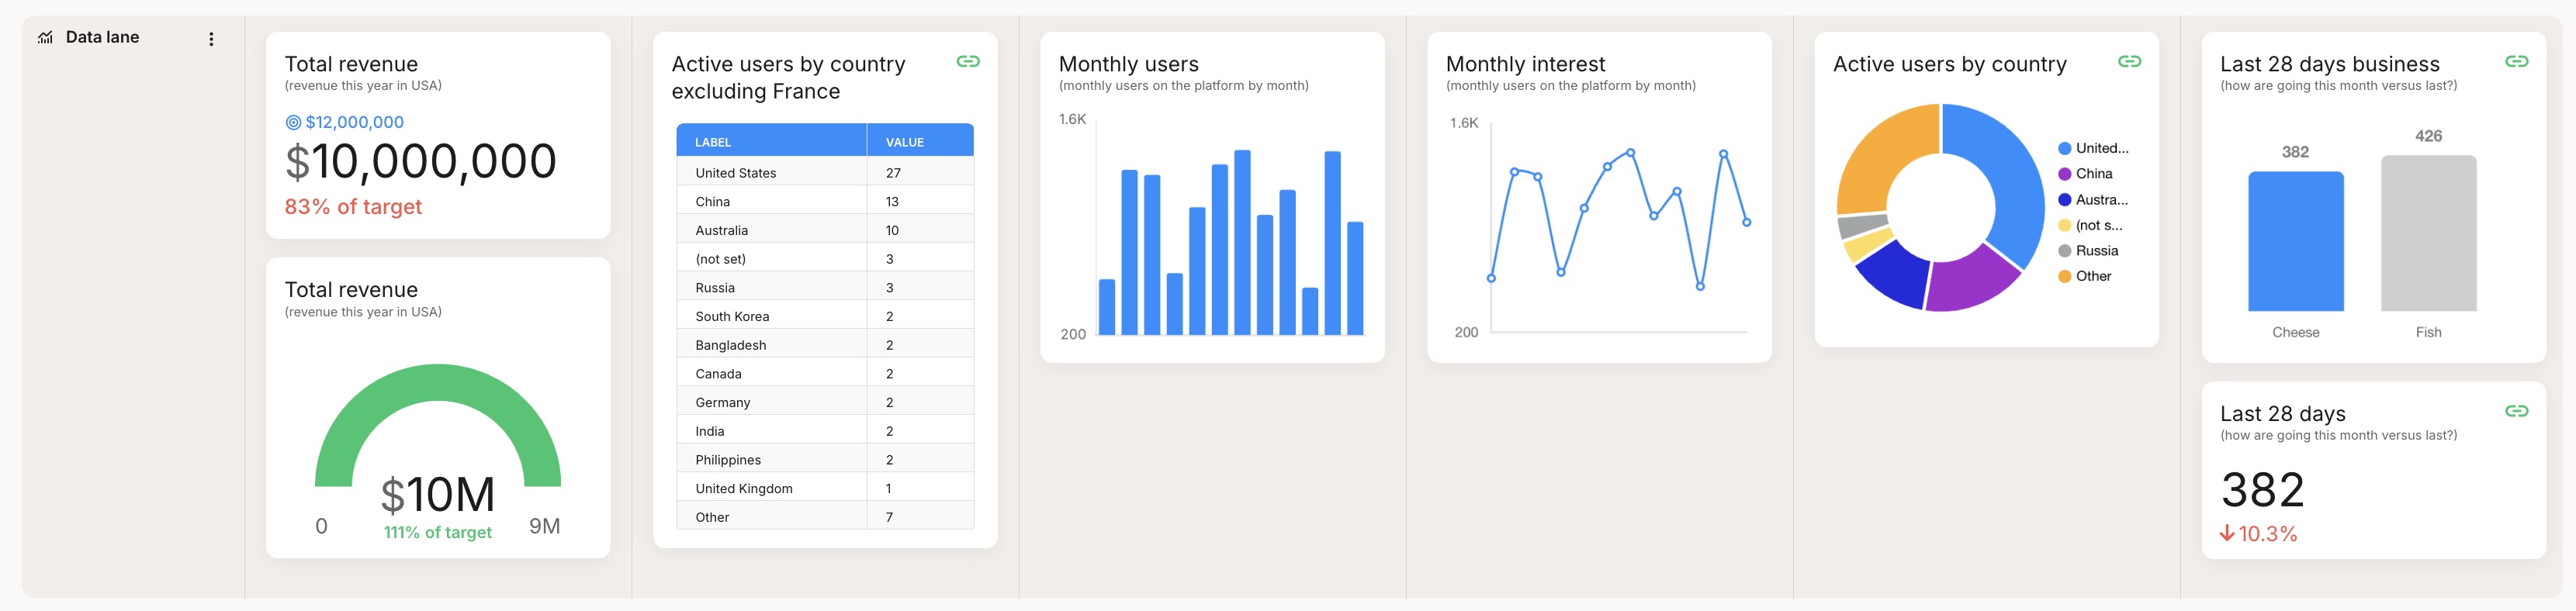
Types of Metrics 📉📈📊
- Number Metrics: Single values with optional targets, shown as gauges or simple numbers.
- Series Metrics: Data trends or comparisons, visualized as pie, bar, horizontal bar, line charts, or tables.
- Comparison Metrics: Compare two numbers, highlighting improvements or decrements.
Choose the right chart type to make your data easy to understand at a glance. Consider your audience and the story you want your data to tell.
Getting Started with Metrics 🚀
- Identify key performance indicators (KPIs) relevant to your customer journey
- Set up integrations or prepare your data for import
- Add metric lanes to your journey map
- Configure your metrics with appropriate visualizations and targets
Start with manual metrics and quickly get the visulaization you want. Then transition to live data sources.